
Armenia’s climate risks on an interactive map: what users can find out
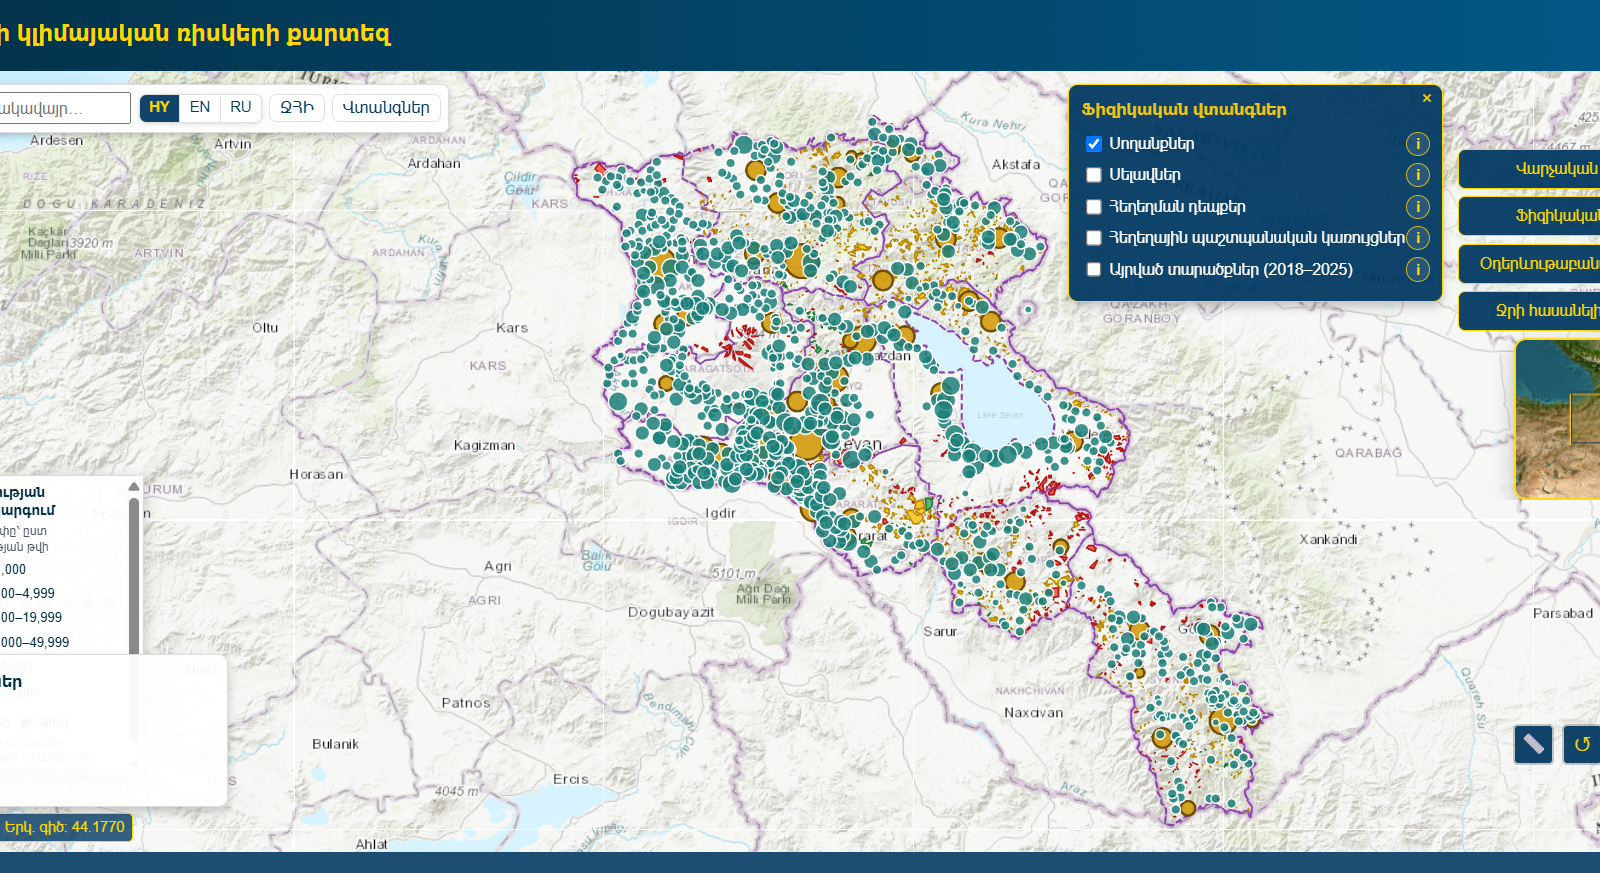
Where have landslides and mudflows been recorded, how have temperature and precipitation changed, and which climate hazards affect different settlements in Armenia? For those looking into these questions, the Central Bank of Armenia, with support from the Asian Development Bank, has developed an interactive map of Armenia’s climate risks. The project’s results were presented at the Central Bank on September 29.
The maps bring together data on climate and natural hazards at settlement level, creating a common information base for their preliminary assessment. They include layers on drought, heat, floods, mudflows, landslides, hail, frost and water availability.
The platform lets users choose what information they want to see. In the menu opened with the “Basemaps and layers” button, they can switch the boundaries of provinces and settlements on or off, as well as the layers for landslides, mudflows and flooding events. The same menu contains layers on actual changes in temperature and precipitation in 2011–2025, the historical frequency of drought and burned areas in 2018–2025.
For example, by selecting the landslide layer, users can view the landslide areas shown on the map, while the precipitation change layer shows the geographic pattern of that indicator. Zooming in and selecting different layers helps users focus on the area and hazard they are interested in. The basemap can also be changed, for example to satellite imagery.
The “Physical hazards” section offers separate options for landslides, mudflows, flooding events, flood protection structures and burned areas. Settlement markers also carry information: the size of a dot shows the population group, and its colour shows whether the settlement is a town or a village.
The practical value of the map therefore lies in the ability to select data and view it in a geographic context. Users can examine individual hazards, compare settlements and identify areas that need a more detailed assessment.
The tool is intended primarily for financial institutions. By combining the map data with information on clients, assets and portfolios, they can assess physical climate risks in lending, collateral valuation, insurance and portfolio management, and consider possible adaptation measures.
At the presentation, Central Bank Board member Artak Manukyan said climate risks are increasingly turning into economic risks: their effects are already visible and are becoming measurable indicators. He said the map data can be used not only in lending decisions but also in developing preventive, social and financial programmes. Government bodies can also use them in decision-making to assess and prevent future risks.
Lyaziza Sabyrova, Country Director of the ADB Armenia Resident Mission, highlighted the impact of climate risks on the economy and the financial system. She said the tool will help assess these risks on the basis of reliable data, and that ADB will continue to support efforts to strengthen the resilience of Armenia’s financial system and its capacity to respond to climate risks.
The project’s main results were presented by Ashot Petrosyan, head of the Central Bank’s Financial System Center, and Marine Nikoghosyan, programme officer at the ADB Armenia Resident Mission. They also presented the methodology used to develop the maps, as well as the data and sources. Nikoghosyan said the platform brings together data on climate and water risks, supporting better-informed decisions.
The maps can also be used in spatial and infrastructure planning, agriculture, water resource management and research. However, as the Central Bank’s description notes, they provide a preliminary picture and do not replace on-site studies and professional assessment of a specific property or project. Identifying a hazard on the map is a starting point for assessment: determining the potential damage to an individual building, land plot or investment project requires further study.